
Universal Skin Fold Equation for the Determination of Body Fat
Blake Surina
Exercise Science Center 1101 Regents Blvd Fircrest, WA 98466 (253) 564-6050Statement of the Problem:
Hydrostatic research, long recognized as the “gold standard” for body fat determination, has resulted in the production of a number of regression equations correlating a variety of skin fold measurements to an estimated percent body fat. By using these skin fold equations it became much more convenient to measure body composition and body composition changes in professional or laboratory settings.
Many of these regression equations were derived from studies using subject populations of 50 to 400 subjects. Eventually, about a dozen of these regression equations gained popularity, having their own specific skin fold sites to estimate body composition.
A vast majority of equations were constructed for college aged, active populations, and brought credence to the saying, “We have the most research on two research groups . . . white rats and college students.” Many age groups were left with only one population specific equation. Currently, there has been no widely recognized body fat regression equations for subjects over 72 years of age since the original work of Durnin and Womersley, (1974). In his landmark study, there were only 24 subjects between the ages of 50 to 72 years of age used to create the regression equation to determine body fat.
Skin fold equations also differ dramatically on which sites were found to most correlate with actual hydrostatically determined body fats. Durinin and Womersley used the pre-selected skin fold sites of the biceps, subscapula, suprailiac and triceps, and created a regression equation to best correlate to hydrostatically determined body fat measurements. Jackson and Pollock, (1978) correlated hydrostatically derived body fat estimates to the individual skin fold sites. Jackson found the highest correlations were obtained from the skinfold sites of chest, abdomen and the thigh. There was no common skin fold site used between Durnin and Womersley and the Jackson Pollock equations, adding to the frustration of creating a generalized equation for the prediction of body fat.
Lastly, investigators noted dramatic differences in the prediction of percentage of body fat between equations. For instance the equation in the previous example, Durnin and Womersley averages approximately 8% higher body fats that the equations developed by Jackson and Pollock, (Figures 1 and Figure 2). These differences could be due to relatively small sample sizes (249 to 481 subjects), previous conditioning of the subjects (ranging from patients at an obesity clinic, to ballet dancers), methods of determining residual volume, variations in body and muscle density, and variations in body density formulas employed, (i.e. Siri, Brozek, etc).

The purpose of this paper is to create a Generalized Equation utilizing all of the information currently available for the prediction of body composition, and creating standards for what is considered average, unhealthy, healthy, and minimal body fat.
Procedures:
3384 healthy subjects were given fitness assessments upon joining an exercise wellness facility. All measurements were taken by an experienced investigator utilizing a Harpenden skinfold caliper, (British Ltd.). Skin fold sites measured included the bicep, tricep, abdomen, (males), suprailiac, thigh, subscapula, chest (males), and midaxillary (females) as outlined by Lohman. Three measurements were taken at each site with a fourth measurement if a difference of more than 1 millimeter was noted.
Height and weight were recorded with a Detecto beam balance scale in light indoor clothing to the nearest .1 pound. Height was measured with a wall-mounted stadiometer (Holtain), to the nearest millimeter. Skinfold measurements for each subject were placed into a cross section of commonly used, population specific, skin fold regression equations to predict body fat. The sum of the body fat percentages, obtained from all population specific equations was averaged for each subject, (Figure 3 and Figure 4)
Among investigators and equations used:
Results:
Body fat percentages as an average from commonly used population specific equations was correlated with recorded skin fold sites, height, weight and age.

Table 1: Correlation of skinfold and physiological variables to body fat values obtained from averaging 15 widely used body fat equations for males and females.
Creation of a Generalized Body Fat Equation for Males:
The combination of seven skinfold sites and the subject age was used in the construction of a general multiple regression equation for the estimation of body fat. Correlation between averaged body fat equations and the general equation was r= .970, r squared = .941 Standard Error = 1.491. The resulting curves created, compared both methods: 1) averaged value of all skinfold equations, and 2) construction of a general regression equation are shown to closely mimic one another, (Figure 3).

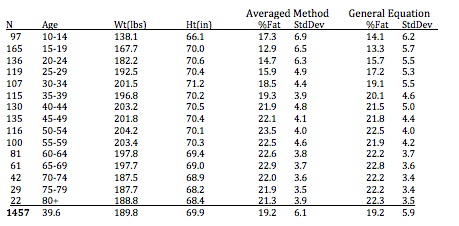 Table 2: Male subjects height weight and body fat estimates using the averaging method and the created general equation on 1457 subjects from 10-96 years of age.
Creation of a Generalized Body Fat Equation for Females
The combination of six skinfold sites and the subject age was used in the construction of a general multiple regression equation for the estimation of body fat. Correlation between averaged body fat equation and the Universal Equation was r= .984, r squared = .968, Standard Error = 0.983. The resulting curves created comparing both methods: 1) averaged value of all skinfold equations, and 2) construction of a general regression equation are shown to closely mimic one another. (Figure 4).

 Table 3: Female subjects height weight and body fat estimates using the averaging method and the created general equation on 1927 subjects from 10-91 years of age.
Creating Standard for a General Body Fat Equation
Creating of a set of standards that are specific to an equation is relatively unknown in the literature. This opens up a number of possibilities for the creation of a system to be easily understood and meaningful to the layperson, as well as the most staunch research investigator. The system employed will be to create a 0.00 to 4.00 GPA scaling system similar to academic institutions. A 2.00 GPA will signify an average body fat for the layperson, but to the researcher it correlates to the mean of the distribution curve.
Minimal body fat will be set at a 4.00 GPA, which would correlate to two standard deviations below the general population mean body fat. To the layperson, this means they have obtained a minimum fat, and to the researcher it means that the value represents the subjects body fat is in the lowest 2.1% of a healthy general population distribution curve. The minimum values will not be lower than 4.5% for males and 13.0% for females.
A 0.00 GPA to the layperson would mean they possess a poor score for body composition, and would be classified as morbidly obese. To the investigator this would mean that the subject has a body fat greater than two standard deviations above the mean for that subject population. This will correlate to a body percentage in the highest 2.1% for that subject population.
By providing the mean body fat for the selected population, and the GPA value for the subject being tested, the entire population distribution curve can be determined. Standards created in this format will provide a more meaningful index of an individual’s assessed body composition measurement.
Minimal, Optimal, Average and Overweight
The last step is the creation of a normal range of fat distribution for this population. A proposal was made to use the study by Tipton, to set a minimal level of body fat for health. A recognized range of minimum body fat was set at 3-5% for male wrestlers, so the lowest allowable value would be no less than 4.5%.
Once the minimum is decided for each age group, an optimal body fat could likely be the average between the normal body fat, and the minimum body fat for that age group. The percent difference between optimal and average body fat, could be used for the setting the difference between average body fat and the upper limit of normal body fat. Using a 0.00 to 4.00 grading scale, 0.00 would be overweight, 2.00 would be average body fat, and 4.00 is optimal body fat. Values for minimal, optimal, average and overweight are listed below:

Ideal Body Weight Recommendation
The Body Mass Index has had a major influence on predicting ideal body weight, but makes no allowance for muscle mass. For this reason, with the addition of body composition determined from the General Body Fat Equation, a more realistic lean body weight value can be incorporated into the recommended ideal body weight. Currently recommended a Body Mass Index values for optimal mortality of 22 for females and 23 for males have been proposed by many experts in the field. Using the General Body Fat Equation, determining the lean body weight, adding in the amount of optimal fat weight, and averaging this value to the subjects Ideal Body Mass index weight will give the recommended Ideal body Weight.
General Body Fat Equation:
Body Fat * Body Weight = Fat Weight
Body Weight – Fat Weight = Lean Body Weight
Lean Body Weight / ((Ideal Percent Body Fat * 100) – 100) = Optimal Fat Weight
Body Mass Index:
(22 BMI for female and 23 BMI for male) * Height (m)^2 = Optimal BMI Weight
Average (Optimal Fat Weight + Optimal BMI Weight) = Recommended Ideal Body Weight.
Discussion:
One obvious advantage that this study possesses is the number and representation from many age groups, including older Americans. Creating standards for the reporting of the data, will allow a system of meaningful scoring of body composition values. Many early studies have suggested that the non-linear regression equations be constructed to represent large population data sets. This study found that the normal aging process, naturally created the curvilinear data without the need of more mathematically unwieldy equations.
The equations constructed with a large subject population showed a standard error of less that 1.5 for males, and less that 1.0 for females in predicting body composition and classifying fatness. These are far superior than the equations created with subjects taken from the 1970’s and 1980’s, with subject populations in the mere hundreds, and with few older subjects.
The Exercise Science Center has created . . .
- a body composition equation that work for large general populations,
- a system of reporting body fat as an age and sex specific GPA format,
- standards for high body fat,
- standards for average body fat,
- standards for optimal body fat,
- standards for minimum body fat,
- a system of identifying ideal body weight.