
By Blake J. Surina
Introduction:
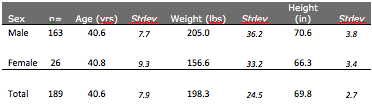
One Hundred and Eighty-Nine Police Officers for a local Police Department were scheduled for a pre-employment physical assessment to determine their levels of physical fitness. One-Hundred and Twenty-Six of the officers were assessed in the hiring process as lateral-transfers from other departments, with an additional 63 police officers assessed as part of a health and wellness incentive program. Fifty-Three percent (63 of 120 officers) from the current hiring police department signed up for the optional fitness and wellness physical assessment. At the conclusion of their individual assessments, all 189 officers were asked to predict their level of fitness for Cardio, Flexibility, and Strength on a 0.00 to 4.00 Grade Point Average scale. A correlation study was performed to see the relationship of Perceived fitness versus Actual fitness across sex, age and body mass for the officers assessed.
Methods:
Each officer was scheduled for a one-hour appointment in which elements of health and fitness were assessed. Heights were taken with a wall-mounted Stadiometer (Harpenden, British Ltd.) in stocking feet, with head in a Frankfort plane, at full inspiration. Weight was obtained in light indoor clothing with a strain gauge scale (Befour Inc. P6600ST). The scale was calibration before the study with a resolution of .1%, and the stadiometer calibrated to a resolution of 1 millimeter.
Table 1: Police Officers Descriptive Statistics
Scores for the assessments performed were given on a 0.00 to 4.00 Grade Point Average format, based on standard deviations from the norm. A 2.00 GPA would correspond to the mean value for the variable tested, (i.e. body fat, bench press etc..). A 3.00 GPA would be a value associated with a one standard deviation better score than the average subject their age and sex. A 1.85 GPA scored on a variable would correspond to a .15 standard deviation lower that the average subject their age, sex and weight. It should be noted that a majority of the scoring should fall with one standard deviations of the mean, (84.1%). All values were scored in comparison to a large database of over 27,000 “normal” subjects that have been tested at a community exercise and rehabilitation facility providing testing services for public sector jobs.
Cardio
Body composition was assessed using a skinfold caliper (Harpenden, British Ltd.) on 7 or 8 sites, by an experienced investigator using regression equations based upon data obtained from approximately 3384 subjects. The equation employed a standard error of estimate of 1.491 for males and 0.983 for females, and employed the same investigator that created the skinfold equation’s to do the assessments, (Surina 2009).
Aerobic Capacity was determined on a submaximal bicycle ergometer (Sensormedic 800S) using three stages of 2 minutes each. The bicycle ergometer was chosen for three reasons: 1) Pedaling at 50 revolutions per minute, without toe-clips, allowed a standardization of skill (i.e. efficiency) between subjects. 2) Workloads can be precisely duplicated in follow-up assessments performed in subsequent years, and 3) Police work often involves bicycle patrol officers. Heart rates were collected using a Polar heart rate monitor, (Polar Vantage XL), with the maximal heart rate and workload recorded (Astrand and Von Dobeln 1967). All aerobic capacity and strength data was allometrically scaled (-2/3 exponential relationship to mass) for the average weight of a male (approximately 195 lbs), and the average weight of a female (approximately 156 lbs) based on reference populations body mass, (Surina 2004).
Pulmonary measurements of Forced Vital Capacity (FVC) and Forced Expiratory Volume in One Second (FEV1.0) were assessed by a Certified Pulmonary Function Technician using equations from the NHANES II study, and recommended by the American Thoracic Society. A value of 100% predicted was assigned a 2.00 GPA value, with <=120% equivalent to a 4.00 GPA, and <=80% equal to a 0.00 GPA .
Flexibility
Range of Motion was measured with an experienced investigator using a Gravity dependent goniometer (Leighton Flexometer). Ranges assessed include hip extension and flexion, trunk extension and flexion, lateral spine flexion, hip adduction and adduction, and shoulder flexion and extension (right side). The assessment of flexibility was performed prior to the bicycle or strength assessments, and was done with the subjects “cold” to standardize the starting condition between subjects. Grading was similar to that used for Cardio using a 0.00 GPA to 4.00 GPA format based on standard deviations for the norm to a similarly matched demographic of age, sex.
Strength
Muscular strength was assessed with a Ariel Dynamics Total Power isokinetic strength testing system. Four major muscle group motor movements were assessed: Bench Press, Leg Press, Lat Pulldown, and Shoulder Press. The protocol was a 5-repetition test at a speed of 20 inches per second. Each subject was allowed a warm-up to get acquainted the isokinetic resistance and to acclimate to the range of motion tested. All subject were given verbal encouragement, and were able to examine their strength curves displayed at the conclusion of each muscle group tested. All values were allometrically scaled to the average body mass for a similar demographic and were graded compared to subjects their own age and sex.
Total Fitness Score
For the three elements of fitness assessed (Cardiorespiratory, Flexibility and Strength), Cardiorespiratory and Strength were weighted at 40% each, and Flexibility was weighed at 20% of the Total Fitness Grade Point Average. Of the Cardiorespiratory section, 50% was from the aerobic capacity bicycle assessment, 40% from the body fat assessment, and the remaining 10% from the pulmonary values assessed for FEV1.0 and FVC.
Perceived Level of Fitness
At the conclusion of the assessment the officers were asked to evaluate their own level of fitness on a 0.00 to a 4.00 GPA. For the Cardiorespiratory section each officer was asked: “a person your age signs up for a local 10K road run finishes on the podium and has six pack abs. That would be a 4.00 cardio person, and at the other end a totally obese slug. Where would you rate yourself”. For flexibility: “that yoga instructor who can put his feet behind their head, martial artists who can do the splits, or gymnasts that can do a back walkover, is a 4.00 GPA, and the total muscle bound weightlifter who cannot even scratch their nose is a 0.00 GPA. Where are you from 0.00 GPA to 4.00 GPA for flexibility?”And strength “the strongest person in the weightroom is a 4.00 GPA and total weakling that cannot lift the weight of the bar is a 0.00 GPA. How would you rate yourself from 0.00 GPA to 4.00 GPA on strength?”The three reported components of their perceived fitness are computed the same as the Total GPA, (40% each for Cardiorespiratory and Strength and 20% for Flexibility).
Results
Estimations of aerobic capacity for the department as a whole was 11.1 METs, percent body fat was 18.7%, and pulmonary measurements were 98.4% for Forced Expiratory Volume in one second (FEV1.0), and 96.2% of Forced Vital Capacity (FVC). Because of differing standards of fitness for male vs female officers, older vs younger officers, and differences in body dimension, adjustments for a standardized scoring system was developed. The scoring system of a 0.00 – 4.00 GPA format was developed using a grading scheme for each subject, based on their own reference population. When scored on a 0.00 to 4.00 scoring format, aerobic capacity was scored at a 2.35 GPA, percent body fat was scored at 3.07 GPA, and the pulmonary values (FEV1.0 and FVC) were scored at 1.98 GPA, and a 1.96 GPA respectively.
The only significant differences between perceived vs actual scores was seen with the older officers and females who under estimated their strength scores, and the over 195 lb. officers who over-estimated aerobic capacity. Younger officers showed a tendency to over estimate their strength scores. For the Total GPA scores the only demographic group with a significant difference in their total fitness scores was the over 40 officers, who over predicted their total fitness, (i.e. predicted 2.69 GPA vs achieved 2.66 GPA).
Table 2: Effect of Sex, Age, and Weight on Fitness Assessments
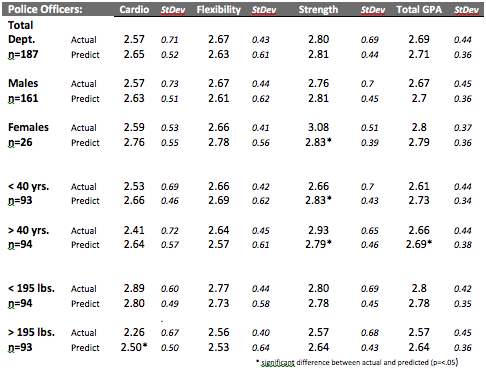
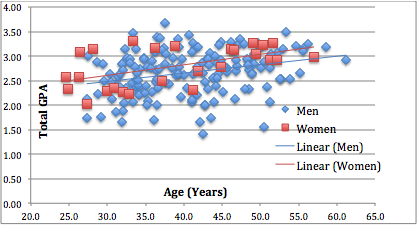
Figure 1: Spread of data points based on sex and age, indicating no significant bias between groups (p>.05)
Age and sex data show the average police officer are more fit than the reference population of “average people”, and this fitness advantage continues to trend upward as they age on the job. There appears to be no apparent advantage in the spread of the data, based on the officer’s combined sex, or age (r =-0.07).It has repeatedly been reported in the literature that strength to weight ratios and aerobic work to weight ratios without allometric scaling can adversely impact larger individuals. The approximate difference between the scaled line (blue) and the unscaled line (red) is the inferred discriminatory effect larger subjects experience using conventional unscaled elements (i.e. mile and a half run, pushups, sit-ups). Although the aerobic scores still trended to lessen with the larger candidates, this was in a large part due to the higher body fats in association with the higher body weights.
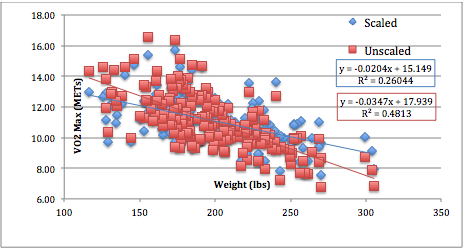
Figure 2: Effect of Allometric scaling and non-scaling of aerobic capacity by weight.
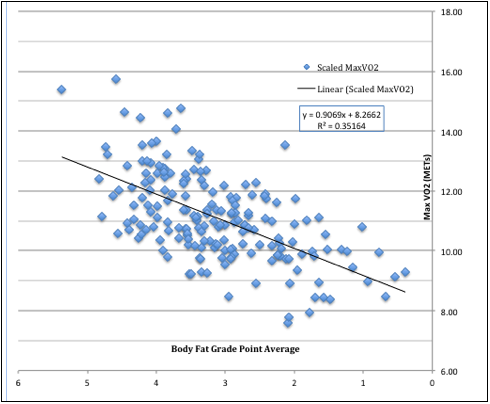
Figure 3: The impact of increasing Body Fat on Aerobic Capacity (METs) Measurements. Grade Point Averages were scaled on a 0.00 GPA to 4.00 GPA, where 0.00 correlates to 2 standard deviations below the mean, and 4.00 GPA correlates to 1.5 standard deviations above the mean. This is to avoid encouraging body fats beyond 2 standard deviations from the mean for grading.
Figure 3 shows the impact of body fat on the allometrically scaled aerobic capacity measurements. Allometric scaling, in an ideal situation, would show no difference due to varying body dimensions, but this assumes the two subjects are proportioned the same, and have the same body composition. Since a negative slope of the allometrically scaled line is still evident in Figure 2, this would likely be due to the body fat percentages being higher in the heavier subjects. This is shown in Figure 3 graph showing the effect on body fat percentage as it relates to scaled aerobic capacity. It should be noted that grade point averages for body composition values are scored with a 4.00 GPA being equivalent to 1.5 standard deviations from the norm. The graph contains data points over 4.00 GPA (standard deviations > 1.5 standard deviations) that are used for the purpose of plotting slope.
Discussion
The purpose of the study was threefold. We wanted to: 1) establish a physical assessment battery to test the fitness of police officers, 2) create a system of scoring for the individual components of fitness that could be understood and mutually agree with the officer would be valid, and 3) Ensure there is no bias to any one demographics group, i.e. sex, age, or body mass. This would allow for reliable, valid and accurate physical assessment for police officers.
The test battery included the major elements of fitness that included Cardiorespiratory (aerobic capacity, body composition and pulmonary measurements), Flexibility, and Strength. The reference populations of over 27,000 fitness assessments were accumulated over 30 years, allowing an excellent database to compare the officers assessed. Using a scoring system with a 0.00 – 4.00 GPA format, based on standard deviations from the mean, could be easily understood by all officers. Body composition measurements were scaled differently in that is was not necessarily considered healthy or desirable to have a body fat percentage two standard deviations from the population mean. It was decided by the investigator that a body fat percentage exceeding 1.5 standard deviations, or higher, would be an optimal level (4.00 GPA) for a healthy body fat percentage, (equivalent to the top 13% of subjects in the sample population).
To test validity, each officer at the conclusion of the assessment was asked to rate his or her performance on a 0.00 to 4.00 grading scale for Cardiorespiratory, Flexibility, and Strength. As the data indicated, an average difference of .04 standard deviations was shown from the perceived (subjective) versus actual (objective) Total Fitness GPA. When breaking down each individual element of separately (Cardiorespiratory, Flexibility, and Strength) for perceived vs actual; across all demographic groups, (male, female, > 40 years old, <40 years old, >195 lbs, < 195 lbs) the correlation between subjective scores and objective measurements was highly significant (r=.756). Individual breakdowns by fitness component had the highest correlations with Cardio (r- .928) and Total Fitness (r-.903), and the lowest correlations were noted with flexibility (r=.488) and Strength (r=.763).
Much of the accuracy was due to allometrically scaling the aerobic capacity and the strength measurements. Proper scaling is paramount on identifying the weight of the subjects that created the standards used. Careful statistics from our reference population of over 27,000 subjects allows for an increased level of predictability. It should be noted that the Exercise Science Center in Fircrest, Washington is the only agency that can perform allometric scaling for body dimension to achieve this level of accuracy.
There were no indicators of any inherent bias for males or females, older (over 40 years), and younger (under 40 years), and heavier (>195 lbs) and lighter subjects (<195 lbs). The older officers did showed a tendency to underestimate their strength scores causing the only significant difference between perceived and actual Total Fitness GPA scores amount all demographics groups. This would make the fitness assessment appropriate and validated as a part of a structured health and wellness incentive program.