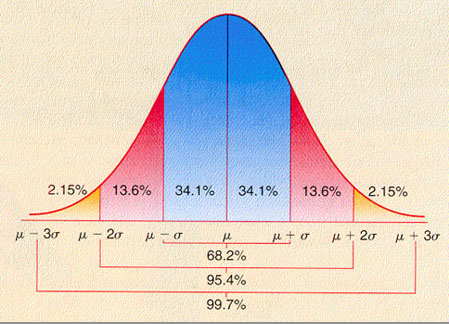
When you collect a lot of data (strength, body fat, height, weight, etc.) from a lot of different subjects, you get some with high values and some with low values. A majority of subjects will congregate toward the middle of the distribution curve. The average value of all the subject’s tested is termed the mean value for that variable. The area in the distribution curve both above and below the mean value is termed the standard deviation from the mean value.
At the Exercise Science Center the results of our evaluations are reported in a 0.00 to 4.00 GPA format, where a 2.00 GPA would be equivalent to the population mean. If the subject receives a score of 3.00 than he would have attained a value 1 standard deviation above the mean. A 0.80 GPA score would be equivalent to 1.2 standard deviations below the mean value. In this way the subject understands his ‘grade’, and the evaluator, investigator and researcher have the ability with the knowledge of the population mean and the subject’s GPA to recreate the whole population distribution curve for that particular variable.
The Exercise Science Center has collected the distribution curves and standard deviations for a great many physiological variables concerned with health and fitness. Our private database in constantly expanding with over 40,000 physiological assessments performed at our facility. We also have a great deal of expertise assessing the fitness of firefighters, police officers, public utility workers, and many other occupational work assessments. The Exercise Science Center also has the ability to recall previous assessments results for individuals that have previously assessed within the last 25 years.
The Exercise Science Center is committed to the highest standards in research collection, and evaluation procedures to ensure the highest quality in our assessment services.

